What is Power BI?
Power BI provides transparent insight into your construction project by converting data into a clear dashboard. You collect this data from different data sources such as SAP, Primavera P6, Excel, Microsoft Project or AX. Power BI then makes this visual, making the most important achievements clear at a glance. How do you put this data to good use and make timely adjustments?
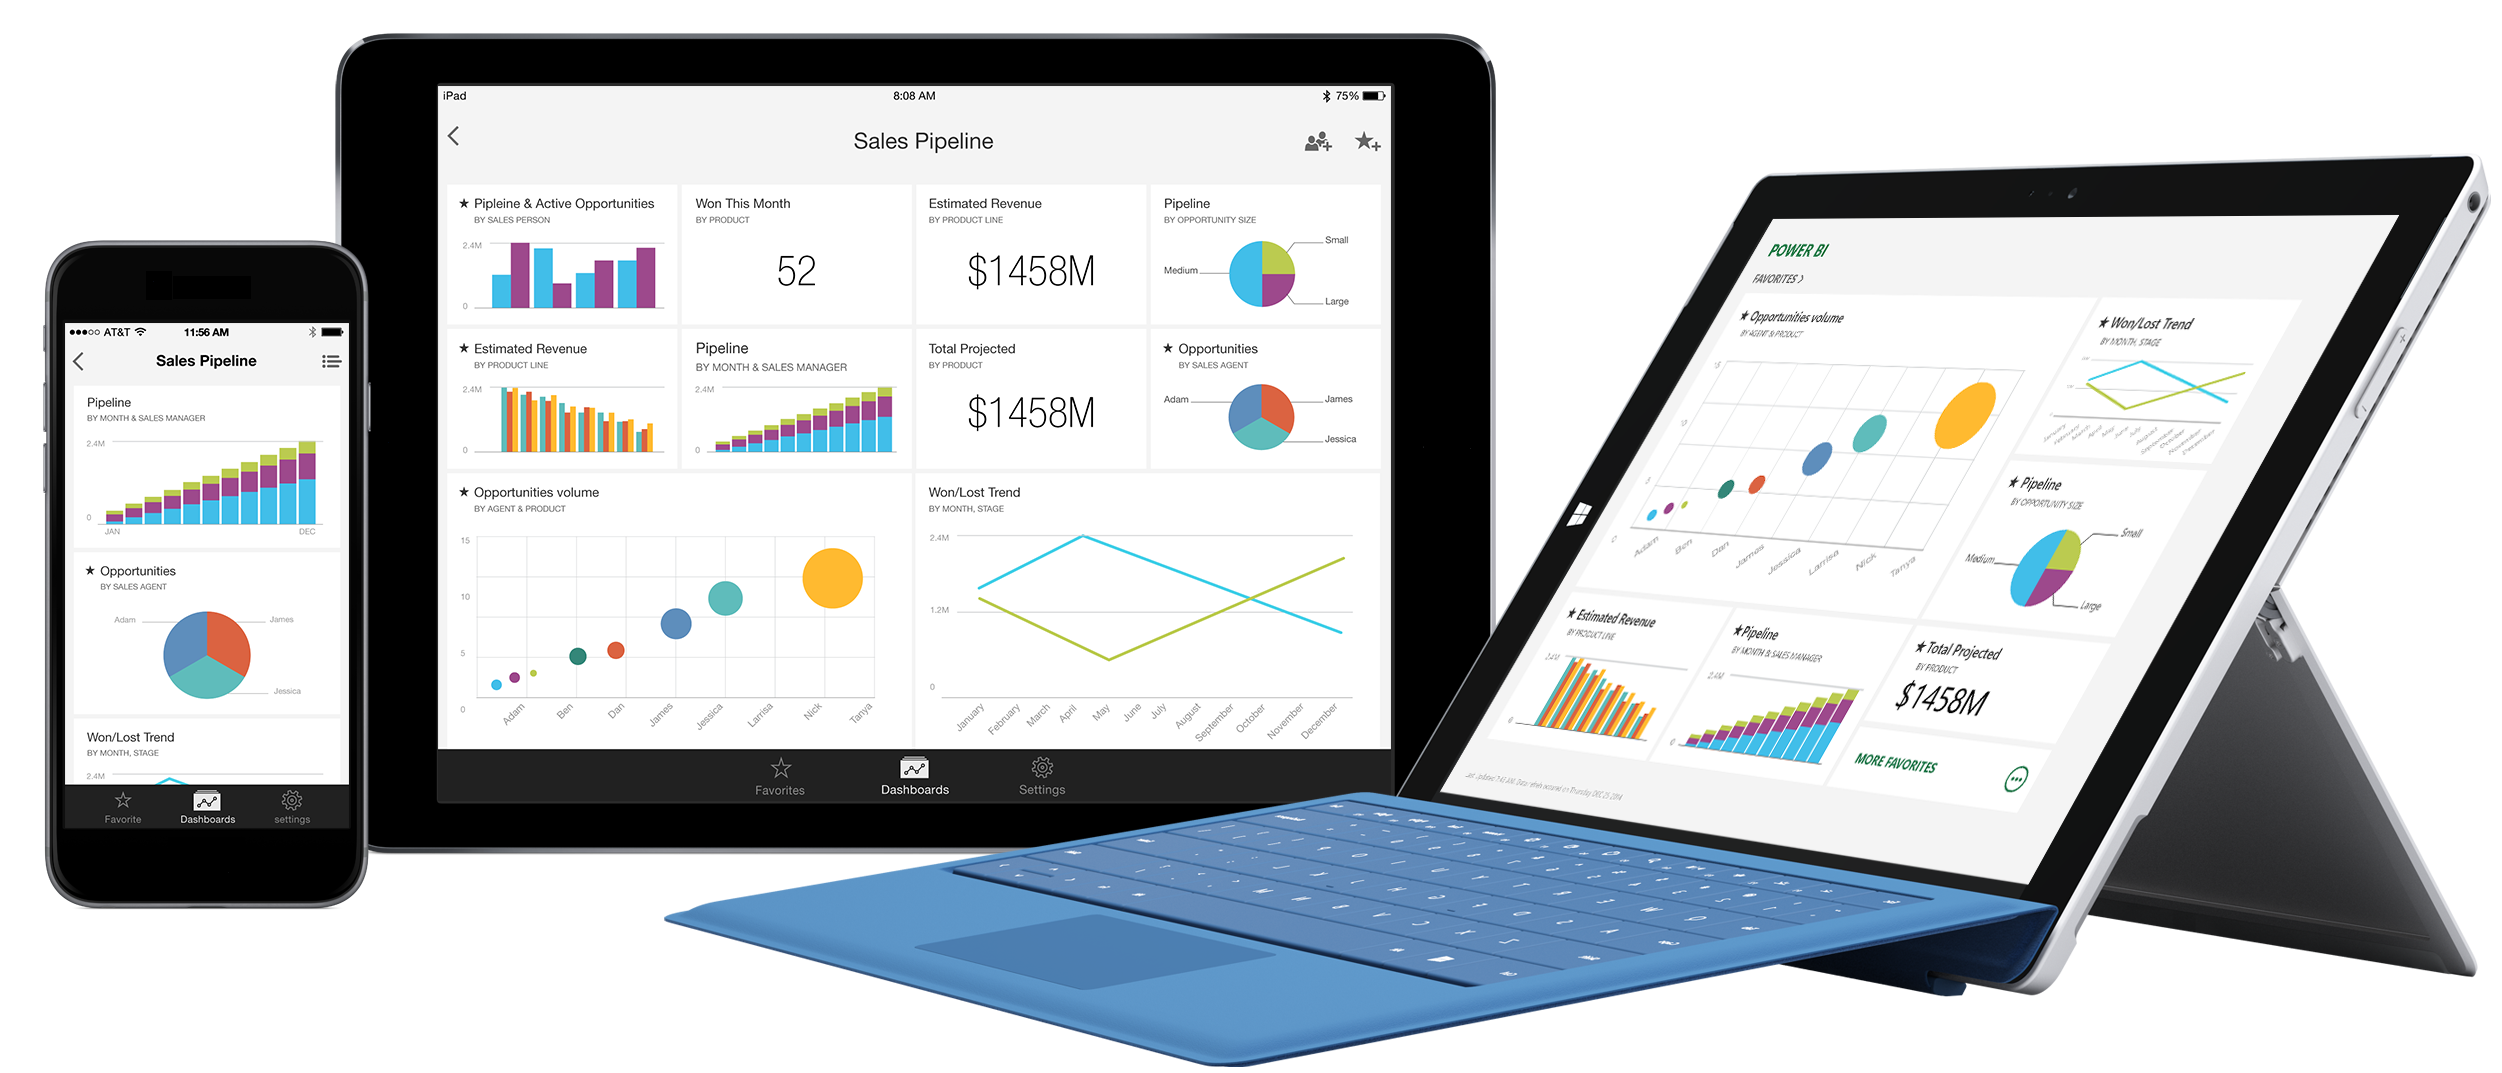
How does Power BI make your construction project transparent?
A Power BI dashboard provides insight into current information and provides context to support business decisions. For projects, you can use Power BI:
- See at a glance where the project is heading
- Create accessible dashboards in real time
- Solid data quality, no more fiddling in Excel
- Monitor KPIs
Power BI for construction companies
WWhy is using Power Bi interesting during a construction project? During construction projects, several events often take place that affect the progress of the construction project. By keeping track of this, the dashboard provides the insights to make quick decisions and act on these events in a timely manner. Additional and reduced work, delays, preliminary and subsequent calculations are examples that are clearly visible to stakeholders in a dashboard.
In a single view see where the project is heading
Data from external parties (subcontractors)
In construction projects you deal with many different external parties who provide data from different data sources and systems. You collect this data in Power BI, which ensures that you maintain control over data and use the dashboard to assess risks or make adjustments. Power BI makes your construction project transparent.
Insight through a dashboard is an important step towards process optimization and control of the project. The first step is to establish measurable management data, which we call KPIs (key performance indicators). With the help of KPIs, measurable data is converted into correct decision-making that fits the project.
Vijverberg Power BI reports
Vijverberg is the specialist in controlling multidisciplinary building and construction projects. Our specialists collect all important data to provide insight in a dashboard. Together we look at which information is important to create an interactive dashboard. You can easily click through this yourself and it is updated periodically. With this management information you can quickly make decisions to adjust a project.

Our approach
Our approach ensures that you quickly have an insightful dashboard. This is our approach:
- What control information is important? Together we determine what information is needed
- Export of data from own systems
- Vijverberg structures the data
- Convert data into a dashboard for management information
- Create a dashboard so that data can be refreshed at the touch of a button
- Continuous up-to-date reports