At the start of every project, it is important to include project risks. In the absence of clear ground rules, including these project risks in the forecast can cause a lot of discussion and ambiguity, as well as inadequate alignment of processes and reporting.
How do you include risks in the forecast?
The ground rules are relatively simple but should be applied consistently. Including an opportunity or risk in the forecast depends on the assessment of the likelihood of the opportunity or risk occurring. estimating the degree of probability of occurrence of the opportunity or risk.
When do you include an opportunity or risk?
It is common practice to divide the degree of likelihood into a number of standard classes that are the same for all projects to avoid false accuracy. If the probability of occurrence is greater than the probability that the risk or opportunity will not occur (‘more likely than not’ principle) then the probability or risk is included for the full amount of the particular risk or opportunity included in the forecast.
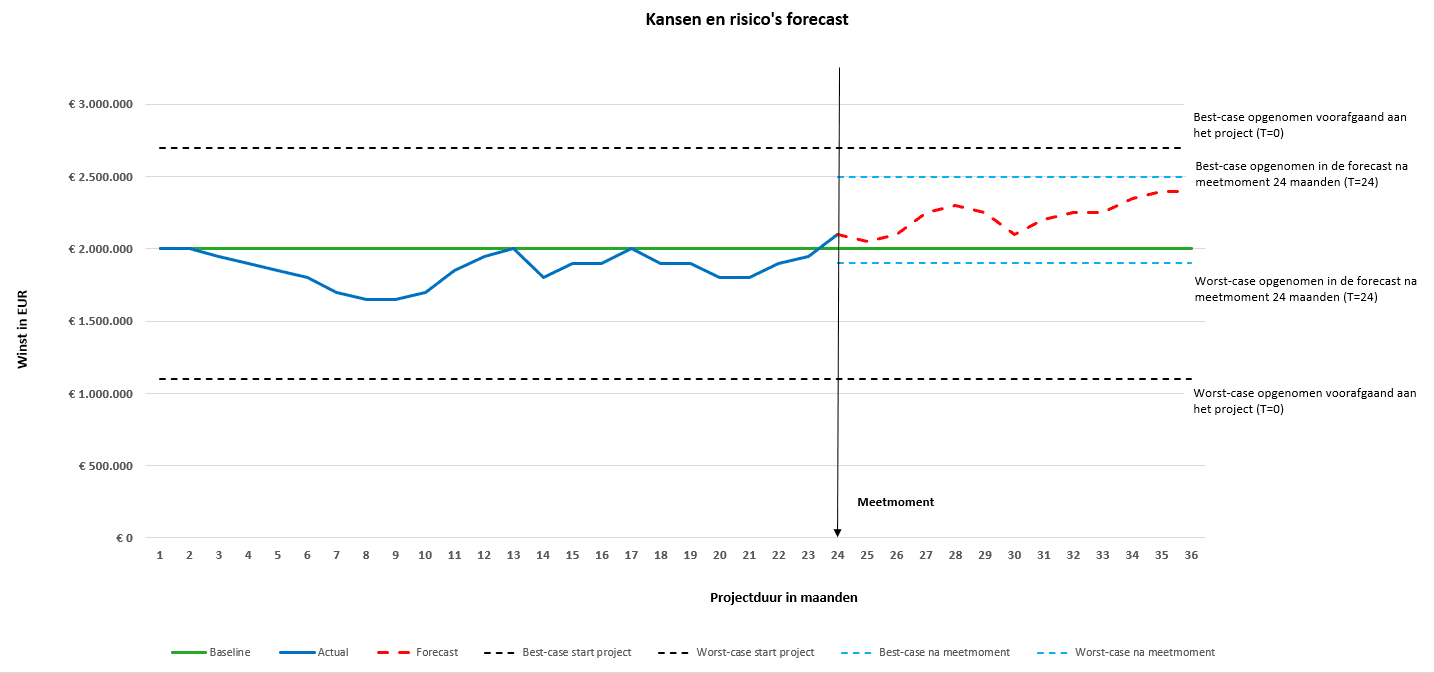
It is not possible to make a reliable forecast without an up-to-date overview of all opportunities and risks of the project. It is therefore possible to keep a good view of the best- and worst-case scenarios during the project. These will also be more predictable due to the shorter time frame. The graph shows a measurement moment after 24 months, here it can be seen that the project is proceeding as expected and that the risks have been properly contained. It is not permitted to label unapproved additional work and claims as opportunities and thus include them in the project result forecast. These should be reported separately with the corresponding status.
Best case and worst case
The risks and opportunities that are not included in the forecast of the project result from the best case and worst case of the project result. Unlike the amounts included in the forecast, for the opportunities and risks with lower probabilities it is advisable to multiply the impact and percentage probability of occurrence. The forecast plus the sum of the probabilities constitutes the best case for the project outcome. The forecast minus the sum of the risks forms the worst case of the project outcome. A graph showing the development of the forecast, best case and worst case of the project outcome over time provides an excellent picture of whether the project is ‘in control’.

The green line in the attached graph shows this forecast. The risks and opportunities not included in the forecast are included in the best- and worst-case scenarios. For these risks and opportunities, it is recommended to multiply the impact and the percentage probability of occurrence.
Reliability of financial project reporting
Focusing on opportunities and risks improves the reliability of financial project reporting. The reporting process and the risk management process should align to achieve effective project control. In this way, the project outcome is improved by actively focussing on realizing opportunities and limiting risks.
